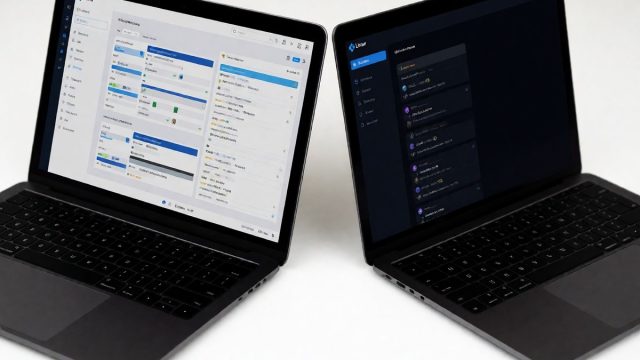
Apache Superset 5.0 changes self-hosted BI for analysts
Apache Superset 5.0 mandates Chrome 122 for dashboards due to a JavaScript dependency, breaking older browsers. Self-hosting costs $900 to $2,000 monthly for 50 users, with load times of 15 to 60 seconds requiring significant engineering optimization.

Superset 5.0.0 introduces a mandatory browser requirement that breaks compatibility with older clients. The dashboard interface now relies on the JavaScript Set.prototype.difference method, which causes a TypeError in browsers that lack this feature. Users must upgrade to Chrome 122 or newer to access dashboards without errors. While charts remain functional in older environments because they do not use this specific method, the dashboard view fails completely. This change forces organizations to audit their internal network segments for outdated browser policies immediately.
Configuration and embedding constraints
The homepage displays dashboard previews instead of a list only when administrators enable the THUMBNAILS feature flag. Setting FEATURE_FLAGS = {"THUMBNAILS": True} in superset_config.py or the environment variable SUPERSET_FEATURE_THUMBNAILS=true activates this default view. Each user can then toggle between list and preview modes, saving their preference in local storage. There is no backend configuration to force all users into preview mode permanently without modifying frontend code. For embedded deployments, the standalone=2 parameter creates a significant operational gap. This mode hides the dashboard header, which prevents the auto-refresh timer from starting. Consequently, charts in embedded iframes stop updating automatically. Developers must implement a JavaScript workaround to reload the iframe at desired intervals, as no native configuration exists to fix this behavior.
Performance and architectural reality
Self-hosting Superset requires a dedicated metadata database, typically PostgreSQL, and a caching layer like Redis for session management and async queries. A production deployment for 50 users costs roughly $900 to $2,000 per month in infrastructure alone, excluding engineering headcount. The platform does not store data but acts as a thin visualization layer over existing warehouses. This architecture avoids ingestion costs but shifts complexity to query optimization. Dashboards often take 15 to 60 seconds to load due to inefficient SQL joins and large result sets. Optimizing within the existing architecture can reduce load times by 40% to 70% without changing databases. However, real-time requirements demand specialized tools like ClickHouse to keep response times under 3 to 5 seconds. Analysts face rigid limitations in chart customization; end users cannot add measures on the fly without developer intervention. Cross-chart measure linking is also impossible, forcing independent configurations for each visual element. These constraints mean that while Superset offers zero license fees, the total cost of ownership includes significant engineering effort for maintenance and performance tuning.
| Component | Requirement | Impact |
|---|---|---|
| Browser | Chrome 122+ | Required for dashboard rendering |
| Database | PostgreSQL | Stores metadata and logs |
| Cache | Redis | Handles sessions and async tasks |
| Embedding | JavaScript workaround | Needed for auto-refresh in standalone mode |
The question remains whether the flexibility of open-source Superset justifies the operational burden compared to managed alternatives. Teams must decide if they can absorb the engineering overhead required to maintain high-performance dashboards. If the answer is yes, Superset provides a powerful foundation for self-service analytics. If not, the hidden costs of "free" software quickly outweigh the savings.

Technewsdaily
Senior tech writer covering AI, gadgets and cybersecurity. Breaking down the news that matters, every day.